Reshaping and Pivot Tables
Reshaping changes how a table arranges its values. In the example below, the long table has one row per date and metric; the wide table has one row per date and one column per metric. This meaning of one row is its grain. pivot rearranges values without aggregating them, while pivot_table combines observations using a summary such as a sum. Decide what each output row should represent before choosing the operation.
Choose the operation
import pandas as pd

observations = pd.DataFrame({
    "date": ["2026-01-01", "2026-01-01", "2026-01-02"],
    "metric": ["visits", "sales", "visits"], "value": [10, 2, 20],
})
wide = observations.pivot(index="date", columns="metric", values="value")

sales = pd.DataFrame({
    "region": ["east", "east", "west"], "product": ["A", "A", "B"], "revenue": [10, 20, 5]
})
summary = sales.pivot_table(
    index="region",
    columns="product",
    values="revenue",
    aggfunc="sum",
    fill_value=0,
    margins=True,
    observed=True,
)
pivot raises when more than one value exists for an index/column pair. That is
a useful grain check. Use pivot_table only when an aggregation is intentional,
and choose the aggregation explicitly.
 Open full-size image
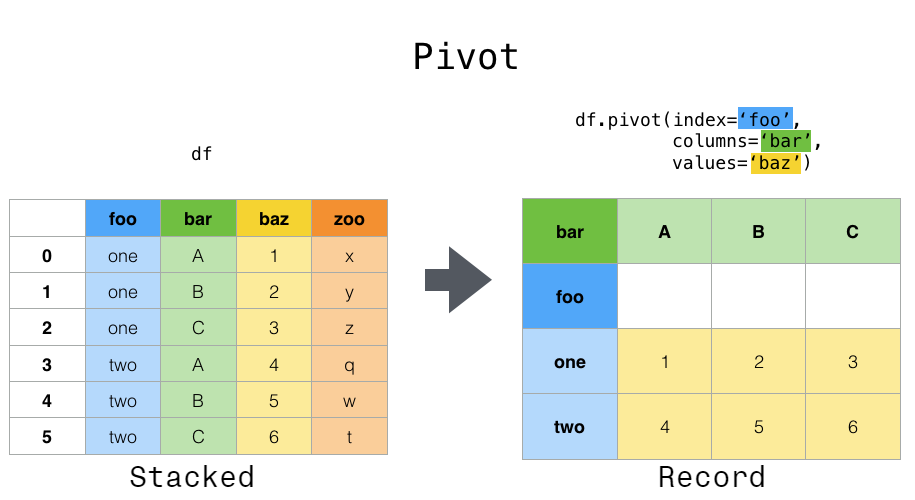
Follow the colors: foo becomes the row index, bar supplies column labels, and baz fills the cells. This pivot rearranges values without aggregation. Repeated index/column pairs require an explicit aggregation choice, as with pivot_table, rather than silently choosing one value.
Return to long form
long = wide.reset_index().melt(
    id_vars="date",
    var_name="metric",
    value_name="value",
)
After reshaping, verify row counts or key uniqueness and distinguish structural
missing combinations from missing observed values. fill_value=0 is valid only
when “no represented observation” truly means zero.
What can be recovered after reshaping
Here wide is (2, 2): visits are 10 and 20, sales are 2 and missing. Melting produces four rows, including the newly represented missing sales combination for January 2. It is not an exact three-row round trip unless that structural absence is handled. Do not blindly drop missing rows if some were genuine observations.
The pivot-table API aggregates the separate sales table: east/A is 30, west/B is 5, and the grand total at summary.loc["All", "All"] is 35. Aggregation loses the individual 10 and 20 observations; melting cannot restore them. margins=True recomputes totals using the aggregation function, so a mean margin is not generally the unweighted mean of displayed group means. Choose observed and dropna explicitly when categorical levels or missing keys affect the intended table.
For a larger example, follow the pandas reshaping tutorial from station measurements in long form to one column per station, then back with melt. Before each operation, predict the output’s row meaning and identify which columns must uniquely identify a value.